
The R/V Thomas G. Thompson left Honolulu on November 5, 2011 heading toward the Western Pacific. This expedition journal was written by cruise participants and uploaded about once per weekday, depending on internet availability.
December 12, 2011: Processing: Lines, colors, and Wiggles
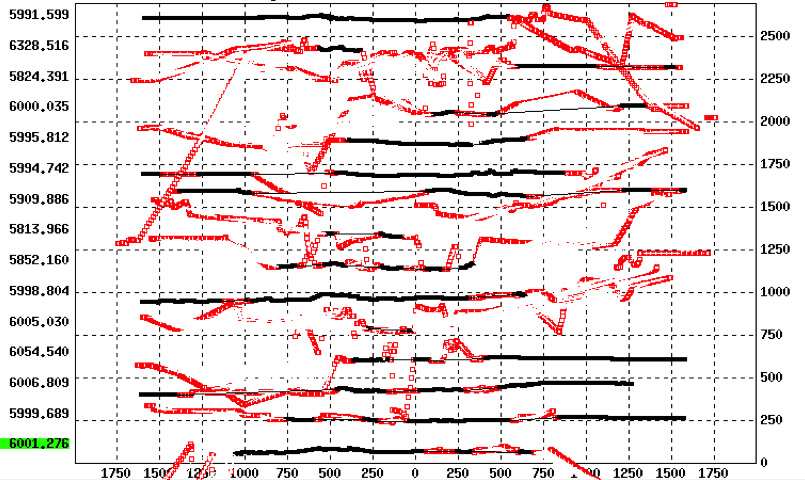
Lot of bad multibeam data, in red
As a watchstander, my duty is to monitor the acquisition of the geophysical data collected during the cruise. This entails watching computer screens as the data comes in: black lines are seismic data, yellow wiggles represent magnetics measurements, rainbow-colored lines are multibeam bathymetry, and the thick black outline of the seafloor comes from CHIRP. However, this first look is raw data output directly from the instruments, which can include noise and various errors. While on board, scientists and watchstanders take a first shot at processing some of this data to remove those errors and make it easier to visualize and interpret.
CHIRP gives us a shallow cross section of the seafloor directly below the boat. It is a great way to see in real-time the profile of the seafloor. CHIRP does not need on-board processing, but it does need constant monitoring. We only save the data that is on the screen during watch, which means we need to constantly supervise it to keep the seafloor on the screen. This is not usually a problem, except when we cross over a seamount. In that case, the outline of the seafloor quickly turns upward, and if we're not careful it can go off the monitor causing a loss of data.
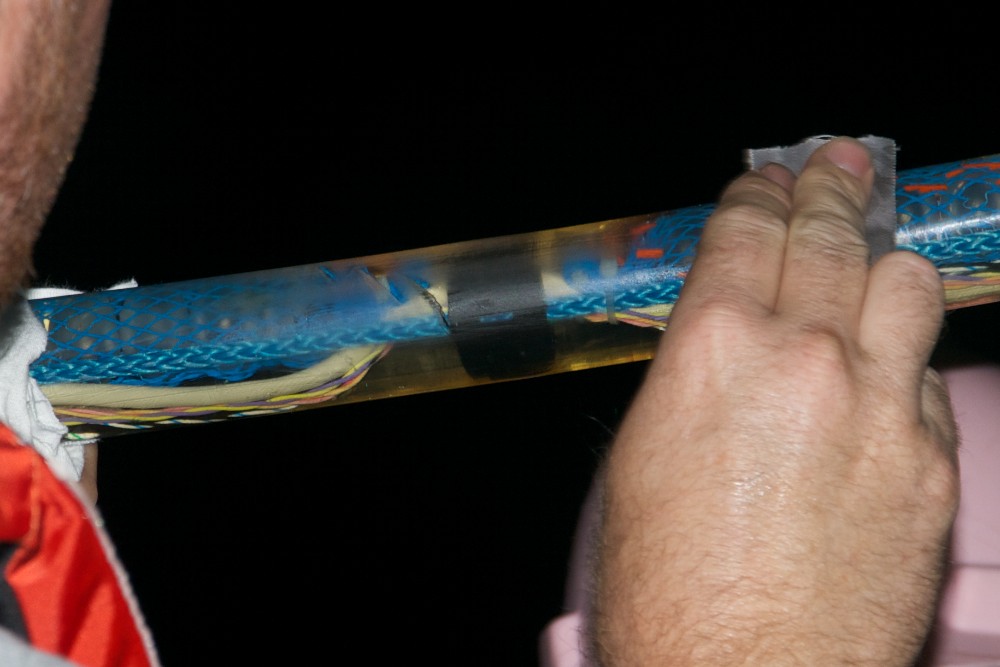
Sharks love hydrophones (Credit: Will Koeppen)
Multi-channel seismic data also creates a profile of the seafloor, but it images deeper than CHIRP. Sam Zhang processes the >500 kilometers of seismic data gathered during the duration of our cruise. For the past few nights, Sam has been teaching me how to take the raw seismic data and produce a cross sectional profile of the area surveyed using ProMAX. Part of this process is filtering out noise. Increased ship speed and bad weather cause the seismic streamer and air guns to bounce in the water, which adds noise that is picked up by the hydrophones, diminishing the actual signal. The channels near the birds (floats) are always a bit noisy since the birds constantly move to keep the streamer at a constant depth. In choppy waves, the buoy at the end of the streamer can also slap the water, causing noise in the last few channels. Hydrophones may get filled with water (e.g., if the streamer is bitten by a shark) and short out causing the loss of a channel. Once Sam has removed the noisy channels and filtered the data, he can begin the involved process of turning it into an image that can be interpreted.

Mr. Magnetics explains (Credit: Masako Tominaga)
Maurice Tivey and Masako Tominaga process the raw magnetic data. They filter the wiggles of data so that they are understandable and show the magnetic anomalies clearly. For example, in the case of TowCam, they need to correct for the heading, depth, and location of the sled as well as its pitch and roll. Because it is being dragged through the water on the end of a cable, TowCam acts like a fishing lure, wobbling and changing depth with ship speed and ocean currents as we move down the line. They also need to consider the bathymetry, because seafloor topography can cause spikes in the data. Maurice and Masako also have to remove the effect of the current global magnetic field of the Earth to make the magnetic anomalies visible. These steps are only a small portion of what goes into processing the magnetic data, and they have to take similar steps to process the surface-towed Maggie and the three magnetometers on Sentry.
Multibeam bathymetry gives us an image of the surface of the seafloor, but it requires a lot of manual editing. It is the only data set that we watchstanders process independently from the other science team members. Bad points in the multibeam data have many sources. The first and biggest source is due to the movement of the ship, which is a combination of the ship’s speed and the outside weather conditions. When waves are high, or if we are moving faster, the boat has a tendency to pitch, roll, and yaw, which can create gaps and spikes in the data. Another source of error comes from assuming that the seafloor is relatively flat. Sometimes a ping may bounce off seamounts that are just to the side of the multibeam footprint and return before pings traveling to the seafloor beneath the boat. Pings can even bounce off objects or animals in the water below the boat (e.g. schools of fish or whales).

Zapping gremlins (Credit: Will Koeppen)
Obviously bad points in the multibeam data, which show up as spikes above or below the average depth, are removed manually by watchstanders using a program called MB-System. This is a command-line based program with a graphical editing screen. You can think of it as an old Atari game where all you see are horizontal lines of dots. Now imagine that the object of the game is to rid the lines of any imperfections so that they are continuous and straight. If you can picture that, then you understand how we edit multibeam data. In reality, the dots represent individual pings returned to the multibeam's receiver, and each line is an ~6-kilometer swath of the seafloor. A file is created every half hour that contains about 200 swaths, and our job is to edit each file after its production. Once the files are edited, we grid the data and import the gird files into another program called Fledermaus. This program creates a three-dimensional map of the seafloor that we've covered on the cruise.
On the ship I witness collection, processing, and the interpretation of marine geophysical data. In some cases, it is relatively easy to process, whereas in others, data processing is complicated and time consuming. After we return, scientists may further process or even reprocess the data depending on the questions they are trying to answer. By learning and partaking in the processing of the data, I have gained a greater respect for the simple dots, lines, and wiggles that I monitor during my watch. ♦