
The R/V Thomas G. Thompson left Honolulu on November 5, 2011 heading toward the Western Pacific. This expedition journal was written by cruise participants and uploaded about once per weekday, depending on internet availability.
December 6, 2011: Sonobuoy Sacrifice
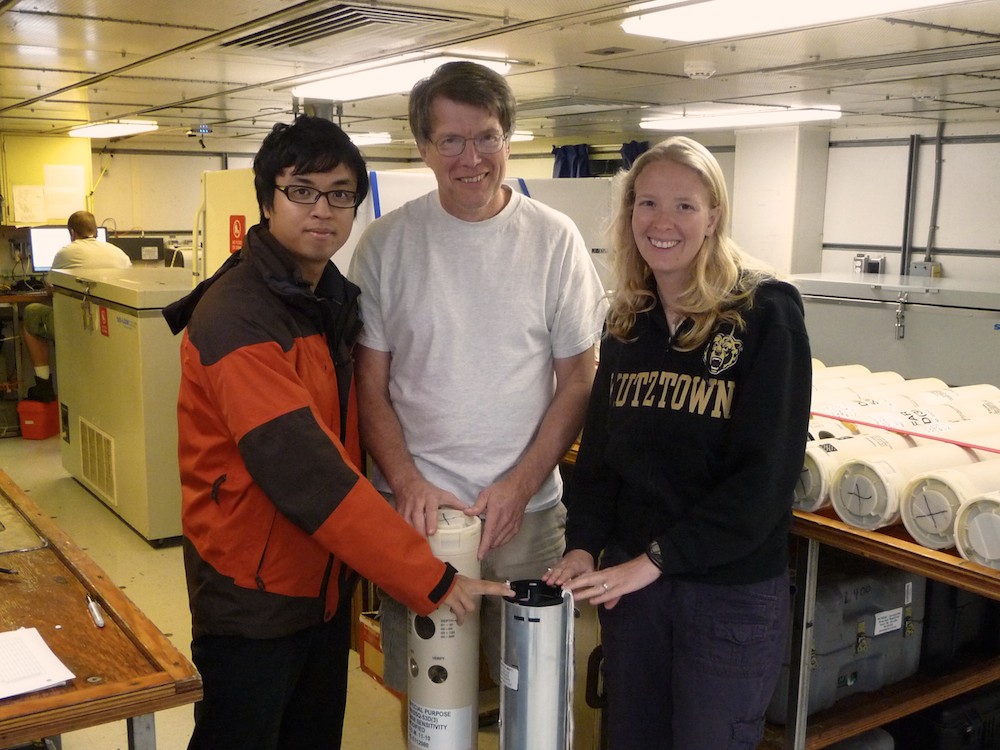
Team Sonobuoy: Sam, Steve, and Adrienne
(Credit: Stephen Swift)
The goal for this cruise is primarily based on acquiring magnetics data, but some ancillary data is needed to validate our interpretations. One of the most important areas of consideration is determining whether or not the magnetic data is coming from the Jurassic-aged seafloor or younger Cretaceous sills/lava flows that may overlay the Jurassic crust. Cretaceous volcanism was voluminous and widespread in this region, and we are only interested in the Jurassic magnetic anomalies. One way we try to identify Cretaceous overprinting is to use multichannel seismic reflection data. However, the hydrophones in the streamer only record data for 11.5 seconds, which limits the depth that we can "see" beneath the seafloor. This means that our seismic profiles image only the sedimentary section and the top of any volcanic material. Therefore, we need another method to get information about the deeper subsurface igneous crust: sonobuoys.

Standing by for launch (Credit: Will Koeppen)
Sonobuoys are an expendable marine hydrophone originally designed to be deployed from airplanes to detect submarines. We toss them off the 02 deck of the ship. Before deployment, the buoy is removed from its casing exposing its parachute (not that it is really needed in this case). To get it ready, we select the channel, recording time, and depth of the hydrophone. Two people take the sonobuoy to the 02 deck on the side of the ship, while another person stands by in the lab to record the precise time and position of deployment. The person launching the buoy wears a lifejacket (just in case they follow the buoy into the water) while the bystander uses a radio to communicate to the data logger in the lab when the buoy hits the water. Once the buoy gets wet, its battery is activated and the metal housing bursts apart (do not deploy in rain!) releasing the hydrophone to the programmed depth and sending up a red float. The buoy must be thrown as far as possible away from the ship (there were contests) so it doesn't get caught by our seismic gear, which trails behind the ship. At first we were deploying the sonobuoys off the starboard side, but some of the buoys got too close to the seismic streamer that trends toward that side of the ship and its birds cut the line connecting hydrophone to its float. The launching team waits to make sure the float comes up and has cleared the air guns, and then they head back inside to watch the sonobuoy signal.
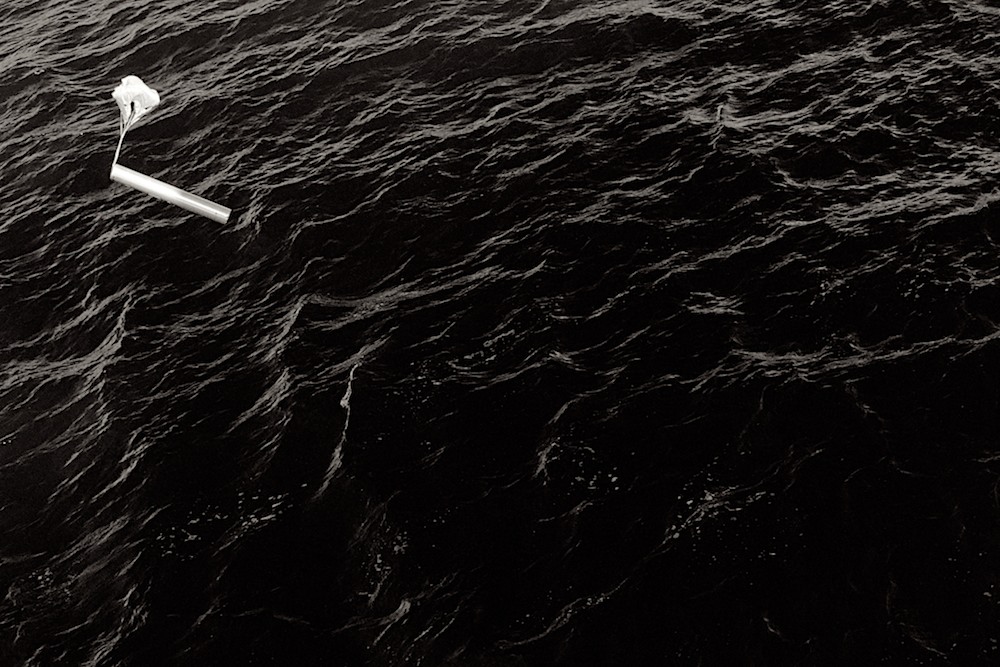
Into the sea (Credit: Will Koeppen)
On this cruise, we use the long-range listening ability of sonobuoys to collect seismic refraction data. Unlike the seismic streamer, which is 800 meters long and follows the ship, sonobuoys remain in one place (ideally) and can record data from the air guns up to 16 kilometers from the ship. At these ranges, there is enough distance between the boat and the sonobuoy to receive signals refracted along layers within oceanic crust. Unlike reflected pressure waves, which bounce directly back to the hydrophone, refracted waves can travel long distances along sediment and rock layers. When they reach the sonobuoy, the waves cause the metal case surrounding a hydrophone sensor at 30–60 meters depth to vibrate. The sensors turn the vibrations into an electrical signal, which is sent up a cable to the float at the sea surface. Inside the float, the voltage is converted into radio waves which are received by an antenna on the flying bridge of the ship. When the signal reaches the lab, the waves are then demodulated (turned into an audio signal) so that the amplitudes of the voltages can be filtered and digitized. These amplitudes are then recorded and plotted on a time versus offset (distance from source) graph. The seismic team refers to this graph and the seismic reflection profiles to try to distinguish whether the igneous material we see is Jurassic or Cretaceous.

Back in the lab (Credit: Will Koeppen)
After eight hours, the electronics in the housing of the each buoy sends a current into the antenna’s resistor. The resistor then increases in temperature, melts a hole through the plastic float, and the buoy starts to sink to its final resting place in 6000 meters of cold, dark water. ♦